
Git and Mercurial both come packaged with handy utilities to visualise the commits in your repository as a graph. We include this functionality in the Codebase interface as well. A few days ago we received an email from one of our customers:
“Following commit (branch) is drawn incorrectly on the graph.
Sure enough, their repository graph was being drawn incorrectly when compared with Git's own output. After a bit of investigation we pinned it down to orphaned branches being handled incorrectly when they reach the end of their history. Orphaned branches are a lesser used feature of Git where a branch can have no relation to previous commits in the repository. We made a small demo repository to replicate the problem.
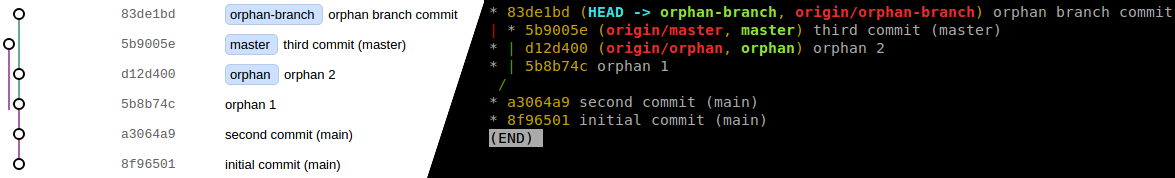
You can see here that the purple line for the master branch needs to join up with the other purple line. It's a small problem, right? Should be easy to fix.
This is not a blog post about when it's time to rewrite a piece of code from scratch. We'll save that for another day. The existing graph generation code had been written in a way that was sympathetic to machines, but in no way sympathetic to other humans. To make things worse, the original author has moved on to other pastures, so we couldn't ask them for any pointers.
After a bit of head scratching and a few cups of tea the decision was made to rewrite the graph generation. We'd do it from first principles. This time it would be well commented and programmer friendly.
Back to Basics
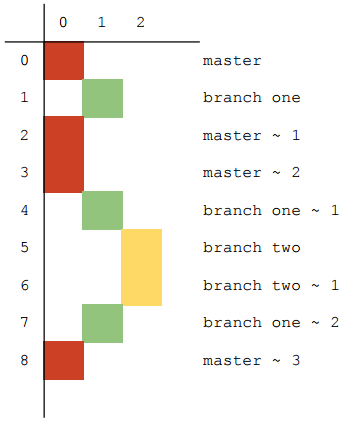
Having broken out a notepad we can examine the basic structure of the commit graph. Commits are arranged from newest to oldest, each on their own line. Each commit is also given it's own branch, arranged from left to right. These two pieces of data give us enough information to arrange commits in a two dimensional space.
To draw the commits we simply need to iterate over them taking their y-coordinate from their position in the list, and the x-coordinate from the branch.
Arranging the branches is simply a case of following the parents of a commit. When a commit is processed, we tag it's parent as belonging to the same branch. If we get to a commit and find it's parent is already in another branch then we know we're dealing with a new branch and draw a split. If a commit has 2 parents, it is a merge and we can draw a line them linking up.
With the branch and commit details figured out we know that each iteration will involve drawing a commit and drawing a line for the branch that commit is on. However, we don't necessarily know at this point how long it will be until we meet the next commit on our branch. To deal with this we need to keep a list of currently active branches. Then, every iteration where nothing happens to a branch we can draw a straight line to continue it.
It can't be guaranteed that all branches that we render will have their current commit included, makes it difficult to determine the branch name. Since the branch name is never displayed on the graph itself we generate sequential numbers to represent branches whenever we see a new one.
Implementation
The original graph in Codebase did some server-side processing and rendered an SVG on the fly. However, it's 2017 now and we have <canvas>. We'll preprocess the graph information on the server using Ruby and do the actual rendering and styling in Javascript with canvas.
The structure for each commit passed to javascript contains all of the information to render the commit, and any of the branches running concurrently with that commit.
{
  ref: "aaff12", // Commit ref, not displayed in the graph but helpful for debugging
  position: 0,   // X-axis location for the commit in this row
  routes: [{
    from: 0,     // X-axis of the starting location for the branch line
    to: 0,       // X-axis for the finishing location for the branch line
    branch: 1    // Branch number (used for colouring the line)
  }, ...]
}
Canvas Painter
It's easier to focus on the frontend code first, since the input data can be easily mocked up. As a newbie to canvas I was worried that it might be the wrong tool for the job, or difficult to work with. Neither of these concerns were necessary, I found interacting with the canvas to be largely thought out and simple.
First up, we create our canvas and get a 2D context to draw on the canvas with.
var defaultOptions = {
  branchColours: ['#0098d4', "#b36305", "#e32017", "#ffd300", "#00782a", "#f3a9bb", '#a0a5a9', '#9b0056', '#003688',
                  '#000000', '#95cdba', '#00a4a7', '#ee7c0e', '#84b817'],
  commitRadius: 6,
  lineWidth: 2,
  yStep: 30,
  xStep: 10
}

function CommitGraph($container, graphNodes) {
  this.options = defaultOptions;

  // Make the canvas and get a 2D context we can draw on
  this.canvas = document.createElement('canvas');
  this.ctx = this.canvas.getContext('2d');

  // Draw on the canvas
  this.drawGraph(graphNodes);

  // Add the finished canvas to the container to display it on the page.
  $container.append(this.canvas);
}
We're almost ready to start drawing our graph. Remember how we reduced our positions to simple two dimensional co-ordinates? We need functions to turn these into absolute co-ordinates that can be used on our canvas.
CommitGraph.prototype._yPositionForIndex = function(yIndex){
  return (yIndex + 0.5) * this.options.yStep;
}
CommitGraph.prototype._xPositionForIndex = function(xIndex){
  // Subtract the position from the width to right-align our elements
  return this.canvas.width - ((xIndex + 1) * this.options.xStep);
}
Now we can position our elements on the canvas we're ready to start drawing. We'll need two methods for drawing, one to draw commits, and one for drawing lines between commits.
CommitGraph.prototype._drawCommit = function(commit, yIndex){
  // Thicker lines for the circles, or they look odd
  this.ctx.lineWidth = this.options.lineWidth * 2;

  var x = this._xPositionForIndex(commit.position), // Positioning of commit circle
      y = this._yPositionForIndex(yIndex),
      innerRadius = this.options.commitRadius - this.options.lineWidth;

  this.ctx.fillStyle = "#ffffff";
  this.ctx.strokeStyle = "#000000";
  this.ctx.beginPath();
  this.ctx.arc(x, y, innerRadius, 0, 2 * Math.PI); // Draw a circle
  this.ctx.stroke(); // Draw the outer line
  this.ctx.fill(); // Fill the inner circle
}
CommitGraph.prototype._drawRoute = function(route, yIndex){
  var fromX = this._xPositionForIndex(route.from), // Starting position for route
      fromY = this._yPositionForIndex(yIndex),
      toX = this._xPositionForIndex(route.to), // Ending position for route
      toY = this._yPositionForIndex(yIndex + 1);

  this.ctx.strokeStyle = this._branchColour(route.branch); // Gets a colour based on the branch no.
  this.ctx.lineWidth = this.options.lineWidth;

  this.ctx.beginPath();
  this.ctx.moveTo(fromX, fromY); // Place the cursor at the start point
  this.ctx.lineTo(toX, toY); // Draw a line to the finish point

  this.ctx.stroke();
}
You'll notice both of these methods are passed a yIndex, instead of using anything embedded in the passed objects. Since the y-coordinates are produced when iterating through the commits there is no need to store them separately. As such, our control loop(s) look like this:
CommitGraph.prototype._drawGraph = function(graphNodes){
  graphNodes.forEach(function(node, yIndex){
    // Draw the routes for this node
    node.routes.forEach(function(route){
      this._drawRoute(route, yIndex);
    }.bind(this));

    // Draw the commit on top of the routes
    this._drawCommit(node, yIndex);
  }.bind(this));
}
That is the nuts and bolts of the canvas renderer. In our production version we've got a few extra bells and whistles such as scaling for HiDPI displays Bézier curves, for branching and merging. However, I've omitted them from this example for simplicity's sake.
Commit Preprocessor
We need to generate one graph node for each commit. Looking back to the beginning of this section we know that each node needs commit information and details about the other active branches to build routes. Our server-side preprocessor looks like this:
def process
  commits.map do |commit|
    node = GraphNode.new(commit.id)
    node.branch = find_or_create_branch(commit)
    node.position = branch_position(node.branch)

    if commit.parents.length == 0
      node.routes = orphan_commit(node, commit)
    elsif commit.parents.length == 1 && new_branch?(commit)
      node.routes = fork_commit(node, commit)
    elsif commit.parents.length == 1
      node.routes = straight_commit(node, commit)
    elsif commit.parents.length > 1
      node.routes = merge_commit(node, commit)
    end

    node
  end
end
orphan_commit, fork_commit, straight_commit and merge_commit each generate routes and manage the branches for the commit in question. Put this data into the new canvas renderer and it gives us this:
We've produced the exact same error. Rats. Time for a cup of tea.
We're still in a significantly better position than before we began. We've gone back to the beginning and understand how everything is put together. The from position on the brown route at line 5b8b74c is off by one. Investigating the code that deals with orphaned commits reveals the following:
def orphaned_commit(node, _commit)
  active_branches.delete(branch)

  active_branches.each_with_index.map do |branch, position|
    GraphRoute.new(position, position, branch)
  end
end
All of these lines go straight down, but we've removed a branch. Any branches that were positioned after the removed branch in the active_branches array will have had their index decremented. To combat this we can simply add one to the affected rows, which will make the course correction. We modify our code to read:
def orphaned_commit(node, _commit)
  deletion_index = active_branches.index(branch)
  active_branches.delete(branch)

  active_branches.each_with_index.map do |branch, position|
    if position >= deletion_index
      # Route affected branch lines over to the right one position, now we've deleted a branch
      GraphRoute.new(position + 1, position, branch)
    else
      # Unaffected by the delete as they're before the orphaned branch
      GraphRoute.new(position, position, branch)
    end
  end
end
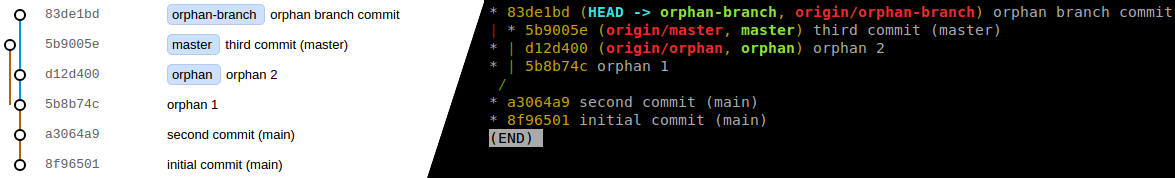
Reloading the page shows the brown line now deftly avoiding the orphaned branch. Victory is ours!

Now we've got the processing and rendering sorted, let's see what happens when we throw a complicated repository tree at it (Image rotated 90 degrees for display purposes).

